Portfolio Data
Portfolio Summary
Portfolio Diversification(by use, by area)
As of April 23, 2024
Entire portfolio
Investment ratio by use
Investment ratio by area
Ratio developed by sponsors
Office
By acquisition price
Hotel
Ratio of international brands
Hotel category classification
| (Note1) | The ratios above are calculated based on the acquisition price (rounded to the nearest one decimal place). |
|---|---|
| (Note2) | International brand hotels refer to Shangri-La Tokyo, Hilton Odawara Resort & Spa, Courtyard by Marriott Tokyo Station and Courtyard by Marriott Shin-Osaka Station. Conrad Tokyo housed in the Tokyo Shiodome Building is not included in international brand hotels as the category of multi-use properties is determined based on their main use. |
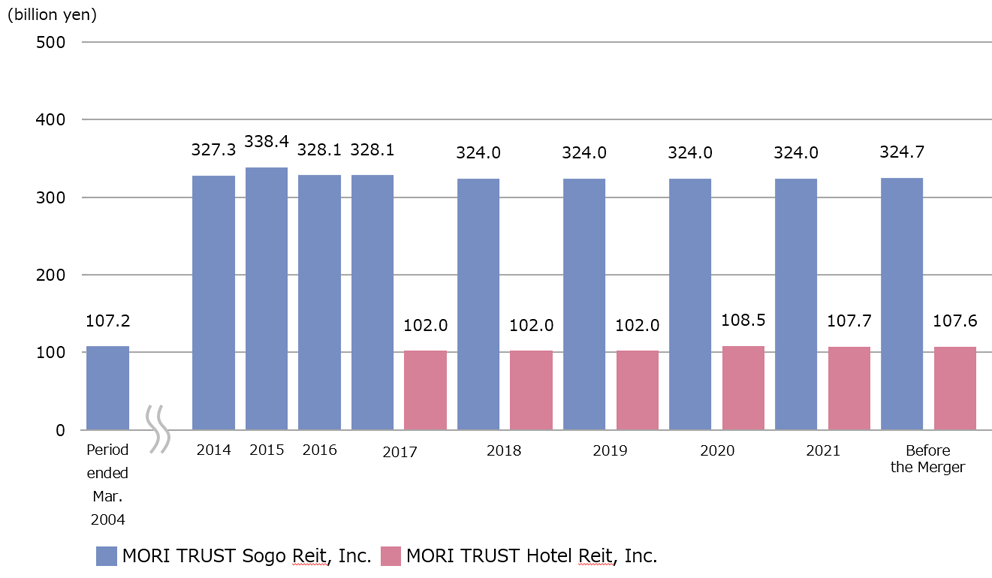
Changes in Asset Size
As of February 29, 2024
(Millions of yen)
Changes in Asset Size before the Merger